
Real-Time Data Analytics with Couchbase and ElasticSearch
This blog was originally posted by David Ostrovsky here on August 11th 2014
TL;DR: Replicate documents from Couchbase to ElasticSearch through XDCR and display real-time analytics in Kibana.
For the less impatient readers, I’d like to tell you about an interesting use-case for getting (near) real-time data analytics with a combination of Couchbase Server, ElasticSearch and Kibana.
This works particularly well if you already have an existing Couchbase database that you’re using for other things, and would like to add some BI or real-time monitoring on the data you storing. For those who aren’t familiar with Couchbase’ Cross Datacenter Replication (XDCR) feature: this is a mechanism that lets you replicate data between two Couchbase clusters. The cool thing is that you can use a plugin for ElasticSearch which implements the XDCR protocol to use the same mechanism for replicating data between Couchbase and an ElasticSearch cluster. Unlike the ElasticSearch river service, which usually works by pulling data from the source periodically, XDCR pushes data from Couchbase into ElasticSearch, which means the replication is much closer to real-time.
Sidenote: Couchbase 3.0, which came out a while ago, has a new mechanism for streaming document changes to XDCR from memory, rather than from disk. This should further reduce the time between a document being changed in Couchbase and the change being reflected in ElasticSearch.
Anyway, let’s get to the meat of the post! The main idea is to use Kibana for aggregating and showing different statistics of the data that’s stored in Couchbase. So the first thing we need is to set up the XDCR replication from a Couchbase bucket to an ElasticSearch index. Normally, when using ElasticSearch as a search front-end for Couchbase, we don’t store any of the document fields as the source – we have the source documents readily available directly from Couchbase. However, in this case we’ll need the values for any fields we intend to analyse in Kibana, so we’ll have to configure a mapping that stores the source values of those fields.
For our example, we’ll store documents representing users in a Couchbase bucket named, unsurprisingly, “users”. We’ll use XDCR to replicate this bucket into an ElasticSearch index named “cb_users”. The user document will have some data fields, including name, age, last GPS location update, and last GPS update data. We’ll load some initial data into the bucket, and then run a simple script that randomly updates the users’ locations and dates. We’ll then use this data to build a Kibana dashboard that tracks statistics about user activity. For simplicity, I’m going to assume everything is installed and running locally, so replace any references to “localhost” as appropriate in your case.
To use XDCR, you will need to install the transport-couchbase ElasticSearch plugin, which is what allows Couchbase to push documents to ElasticSearch. There is a great guide for installing and configuring the plugin in the Couchbase online documentation. The one thing you must do differently from the guide is edit the couchbase template before applying it to. The default template is set to match * (that is, all indices) and doesn’t store the source document at all. If you’re going to use your ElasticSearch cluster for other things besides indexing data from Couchbase, the overly inclusive couchbase template will mess that up.
In our case, we’ll change the default template to store everything in the source and map the fields of the couchbaseDocument type to their respective data types in advance. You could also leave out the couchbaseDocument type mapping and let ElasticSearch figure it out dynamically. The reason I’m hard-coding it in this case is that ElasticSearch doesn’t automatically map the location array to a geo_point. Note that I’m being lazy and storing doc.* in the source. In a real application, you should save the processing and storage by only storing the fields you’ll actually need. After editing the template, apply it to ElasticSearch:
> curl -XPUT http://localhost:9200/_template/couchbase -d @template.json
And then create the cb_users index in ElasticSearch:
> curl -XPUT localhost:9200/cb_users
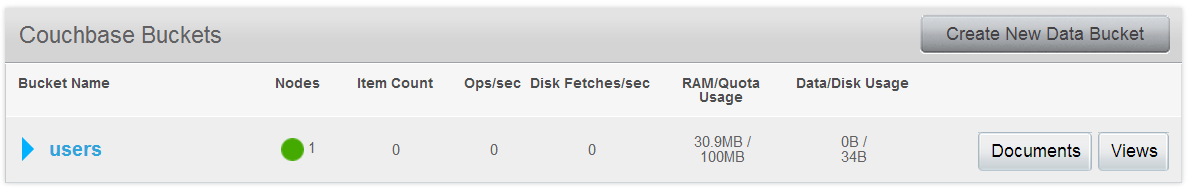
Next, let’s create the users bucket in Couchbase:
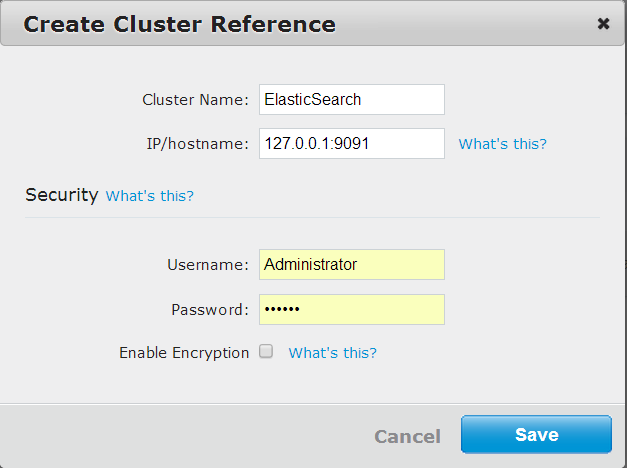
And the XDCR cluster reference to our ElasticSearch cluster:
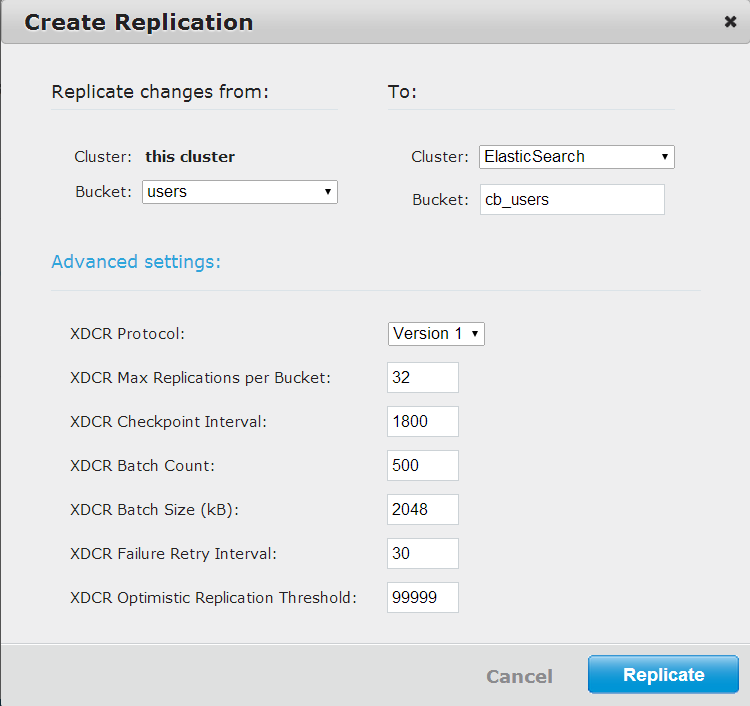
And finally the XDCR replication from the users bucket to the cb_users index:
Now let’s check that the replication is working by creating some documents in Couchbase and searching for them in ElasticSearch. I’m going to use a couple of quick Node.js scripts to create some users in Couchbase and then search for any users located within 10km of the specified coordinates. Running first geoquery_setup.js and then geoquery_test.js should print out some results.
Great, we finally have all the data in place, so now it’s time to create a Kibana dashboard full of awesome pie charts and real-time graphs! I’m going to leave the Kibana installation up to you, because there are just too many ways (and operating systems) to cover. Just get the latest version and do whatever you need to do in order to run Kibana as a local website. If you’re a seasoned Kibana user, just open a blank dashboard and get cracking. Otherwise, you might want to start with a pre-made dashboard that gives you more guidance: open the following URL in a browser http://localhost/index.html#/dashboard/file/noted.json and spend some time reading the instructions.
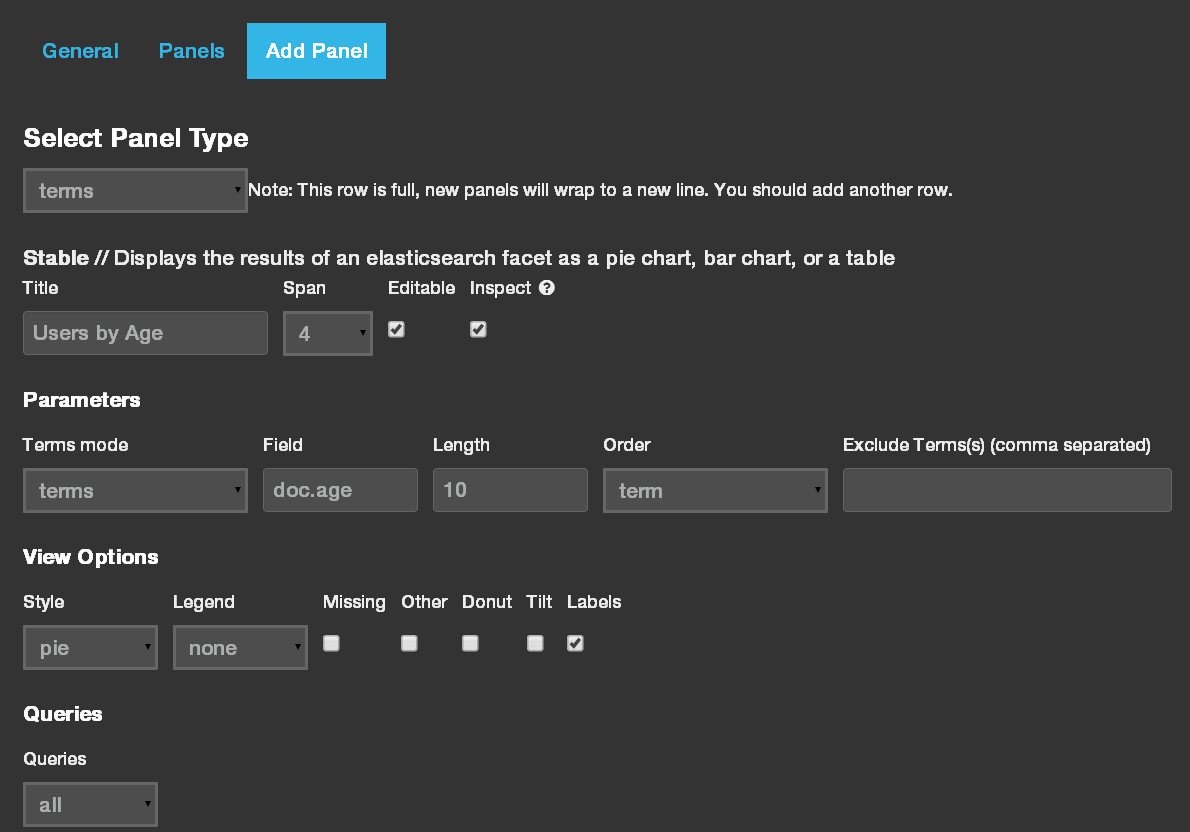
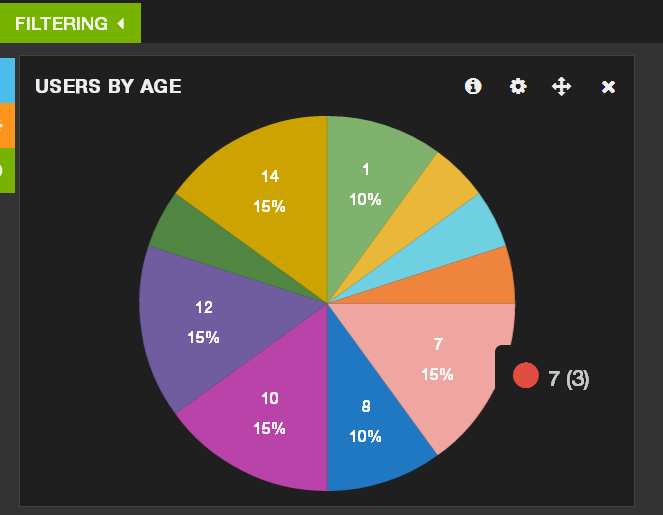
The first thing we’ll do is point our dashboard to the cb_users index and couchbaseDocument type. Open the dashboard configuration (cog icon in the top right), go to the Index tab, change the default index from “_all” to “cb_users/couchbaseDocument” and check the preload fields box. Then go to the Timepicker tab and change the time field to “doc.update_date”. Next we’ll create a pie chart of users by age. In the first row click the green plus (Add Panel) button in the floating menu on the left. Select “terms” from the panel type list, give it a name, set “doc.age” as the field name, and select “pie” from the style list. You can uncheck the missing and other boxes, so the pie chart doesn’t show documents without an age field. Save the panel and admire the results. (This might be a good time to delete the pre-defined text panels, if you’re done reading them.)
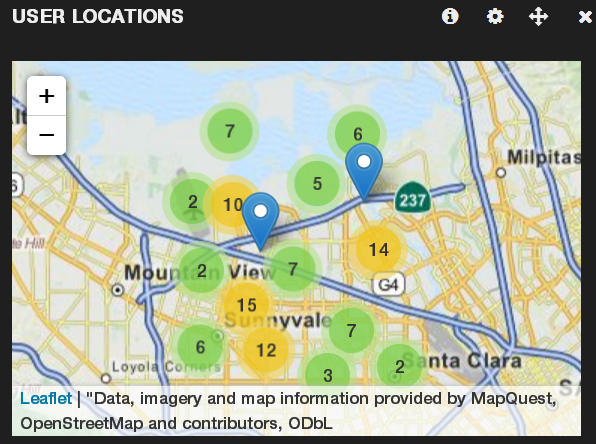
Let’s spice our dashboard up with a map: add another panel to the first row and select “Bettermap” as the panel type. Enter “doc.location” as the coordinate field, and “doc.name” as the tooltip field. Note that Bettermap needs the location field to be a geoJSON array in the format [longitude, latitude], which is why we stored it that was in the user document, instead of the more readable geoJSON object with nested lat and long fields.
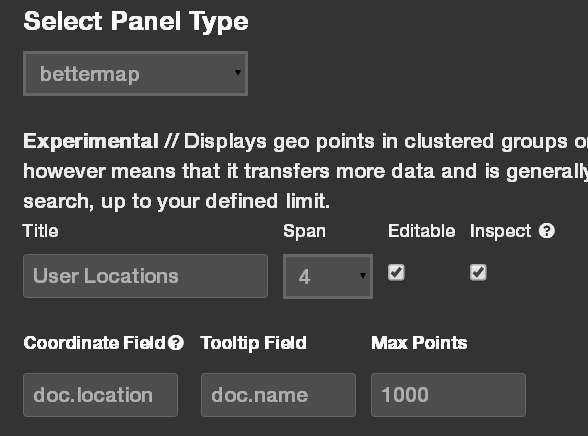
Sidenote: “Bettermap” is a bit of a misnomer. A more appropriate name might have been “it’s-the-only-choice-you’ve-got-so-suck-it-map”. But I digress…
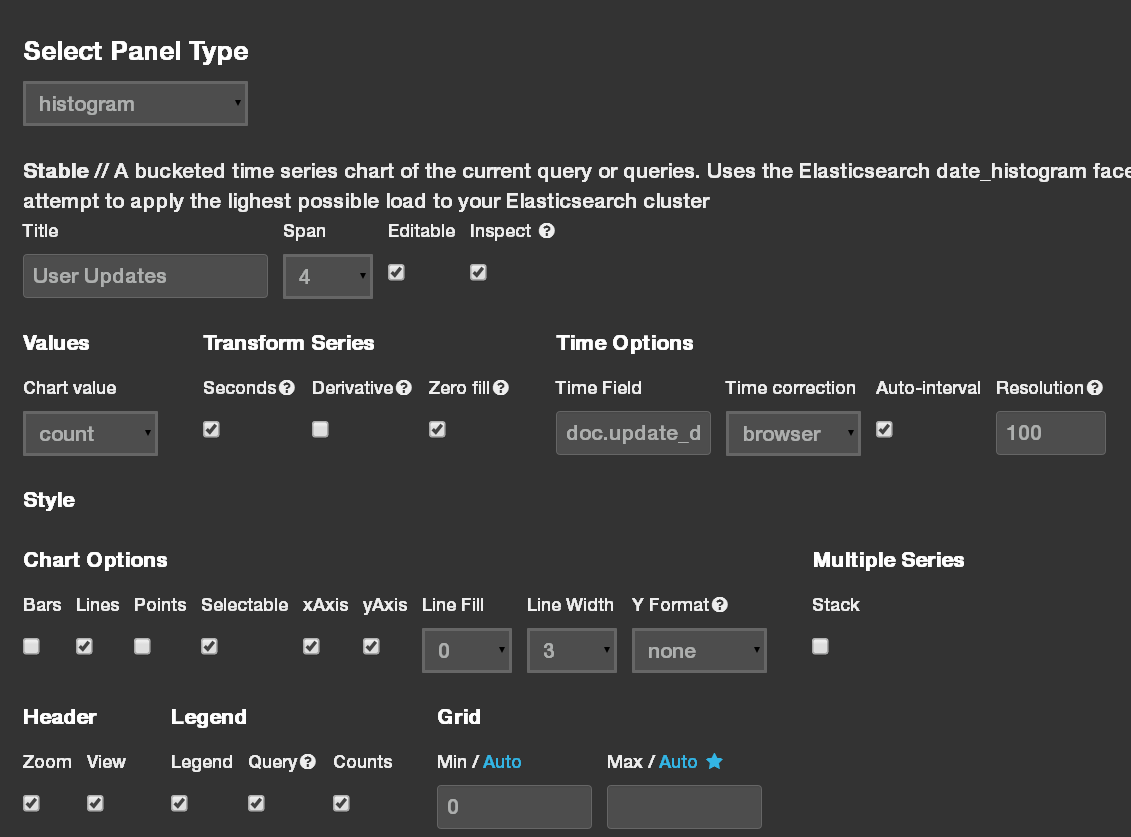
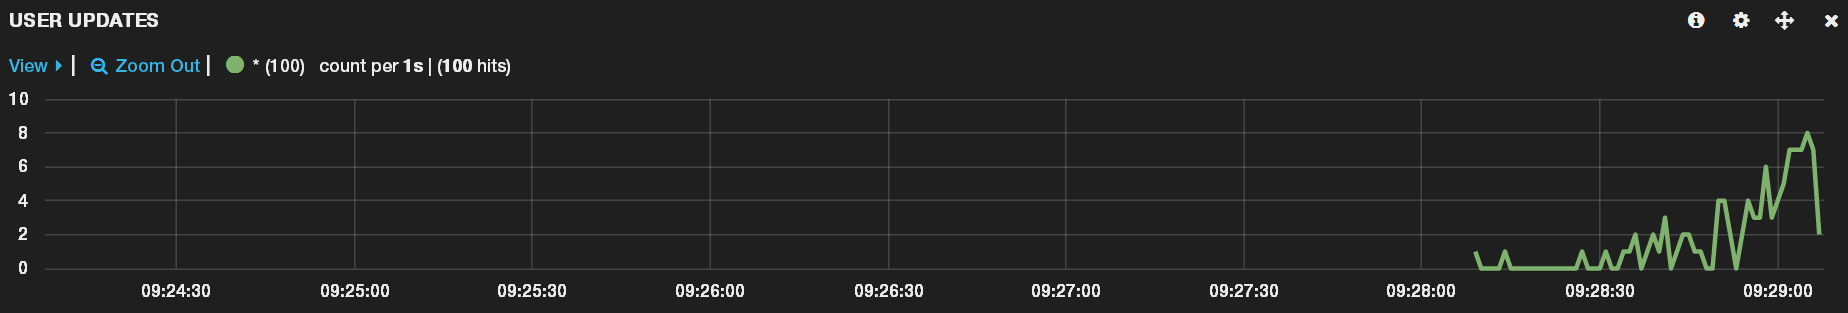
No dashboard is complete without a real-time histogram or two, so let’s add one of those next. Add a new panel to the second row, set the type to “histogram” and the time field to “doc.update_date”. Change the span to the maximum value allowed, to make the histogram span the entire screen width. After you save the new histogram panel, you might want to go to the row settings and reduce its height to a more manageable 150 pixels or so.
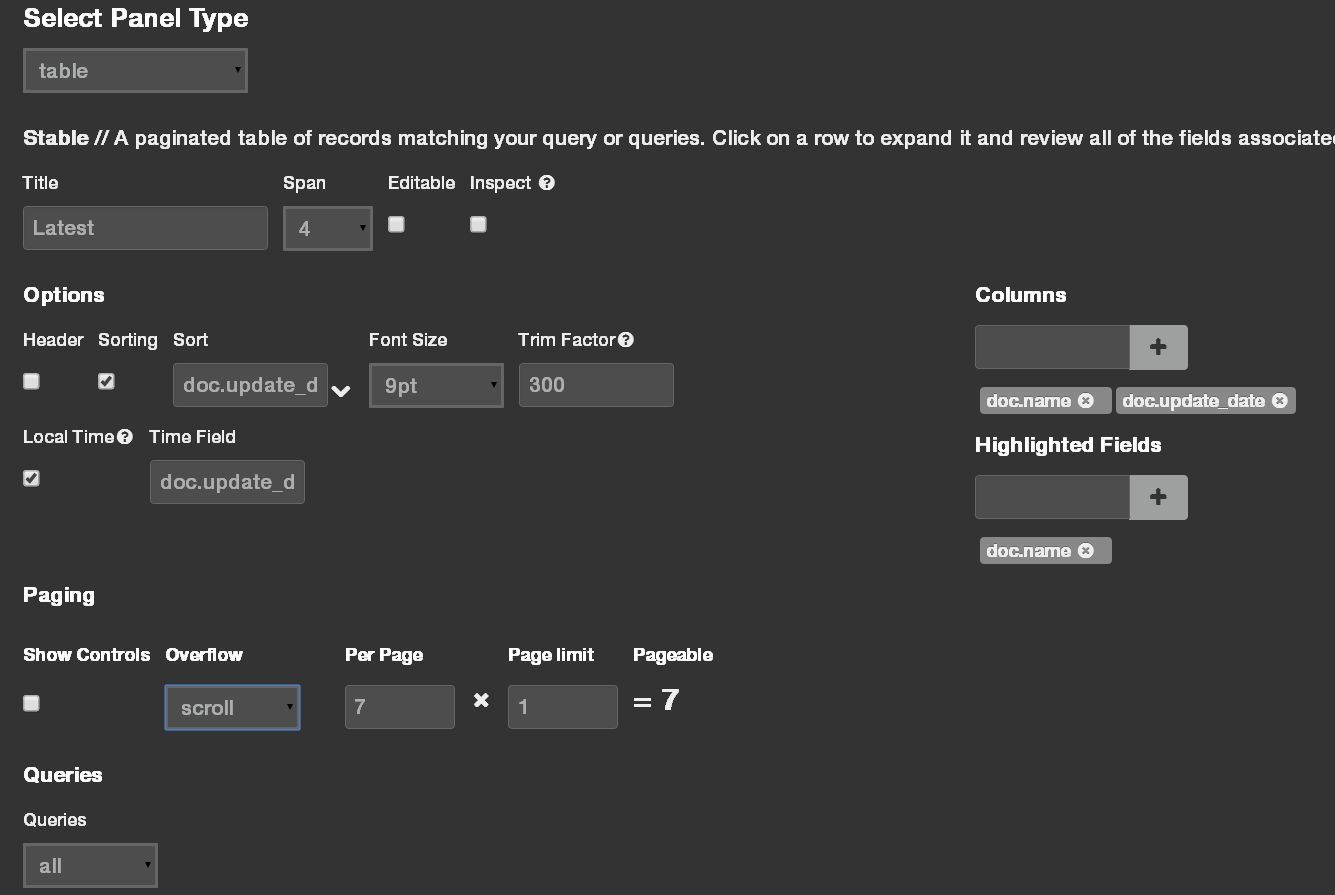
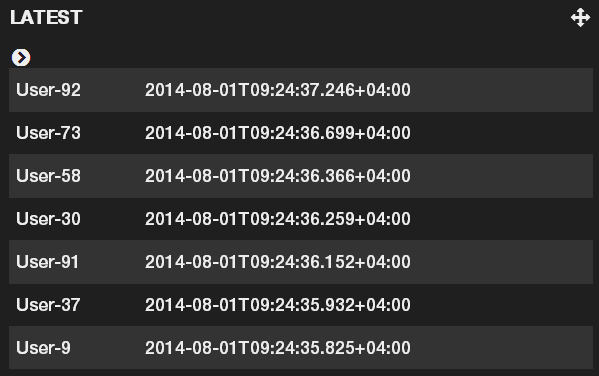
Last, lets add a table to display the most recently updated users. Add a third panel to the top row, select the “table” type, set the sort and local time field to “doc.update_date” field, add “doc.name” and “doc.update_date” to the columns and set paging to 7 results per page and only 1 page, to only show the top 7 results. After you save the panel, minimize the fields list on the left, to leave just the user names and update dates visible.
Alright! All that’s left is to actually change some users and see whether the dashboard works as expected. Run the geoquery_realtime.js script or write your own code for changing user locations and update dates over time. In the Kibana dashboard, set the time filter to auto-refresh every 5 seconds and to display data for the last 5 minutes. Finally, save the dashboard so you can come back to it later by clicking on the save menu in the top right and either clicking the save icon – which will store the dashboard in ElasticSearch – or selecting “export schema” under the advanced menu – which will export the dashboard as a JSON file that you can import later. Here’s mine.
Congratulations, you are now the proud owner of a nifty real-time analytics system!
![]()